


The Golden Horizon: Demand, Supply, and Future Price Trends
Hong Kong, Sep 3, 2024
As the global economy navigates through uncertainty and fluctuating financial markets, gold remains a pivotal asset for investors, central banks, and industries alike. The ongoing hype around gold has sparked renewed interest in understanding the dynamics of its demand and supply, identifying key buyers, and predicting where its price may head in the future.
Gold Supply: Where Does Gold Come From?
Gold production
Gold production is a cornerstone of the global supply, China was the largest producer in the world in 2023 and accounted for around 10% of total global production, followed by major countries like Russia, Australia, and Canada.
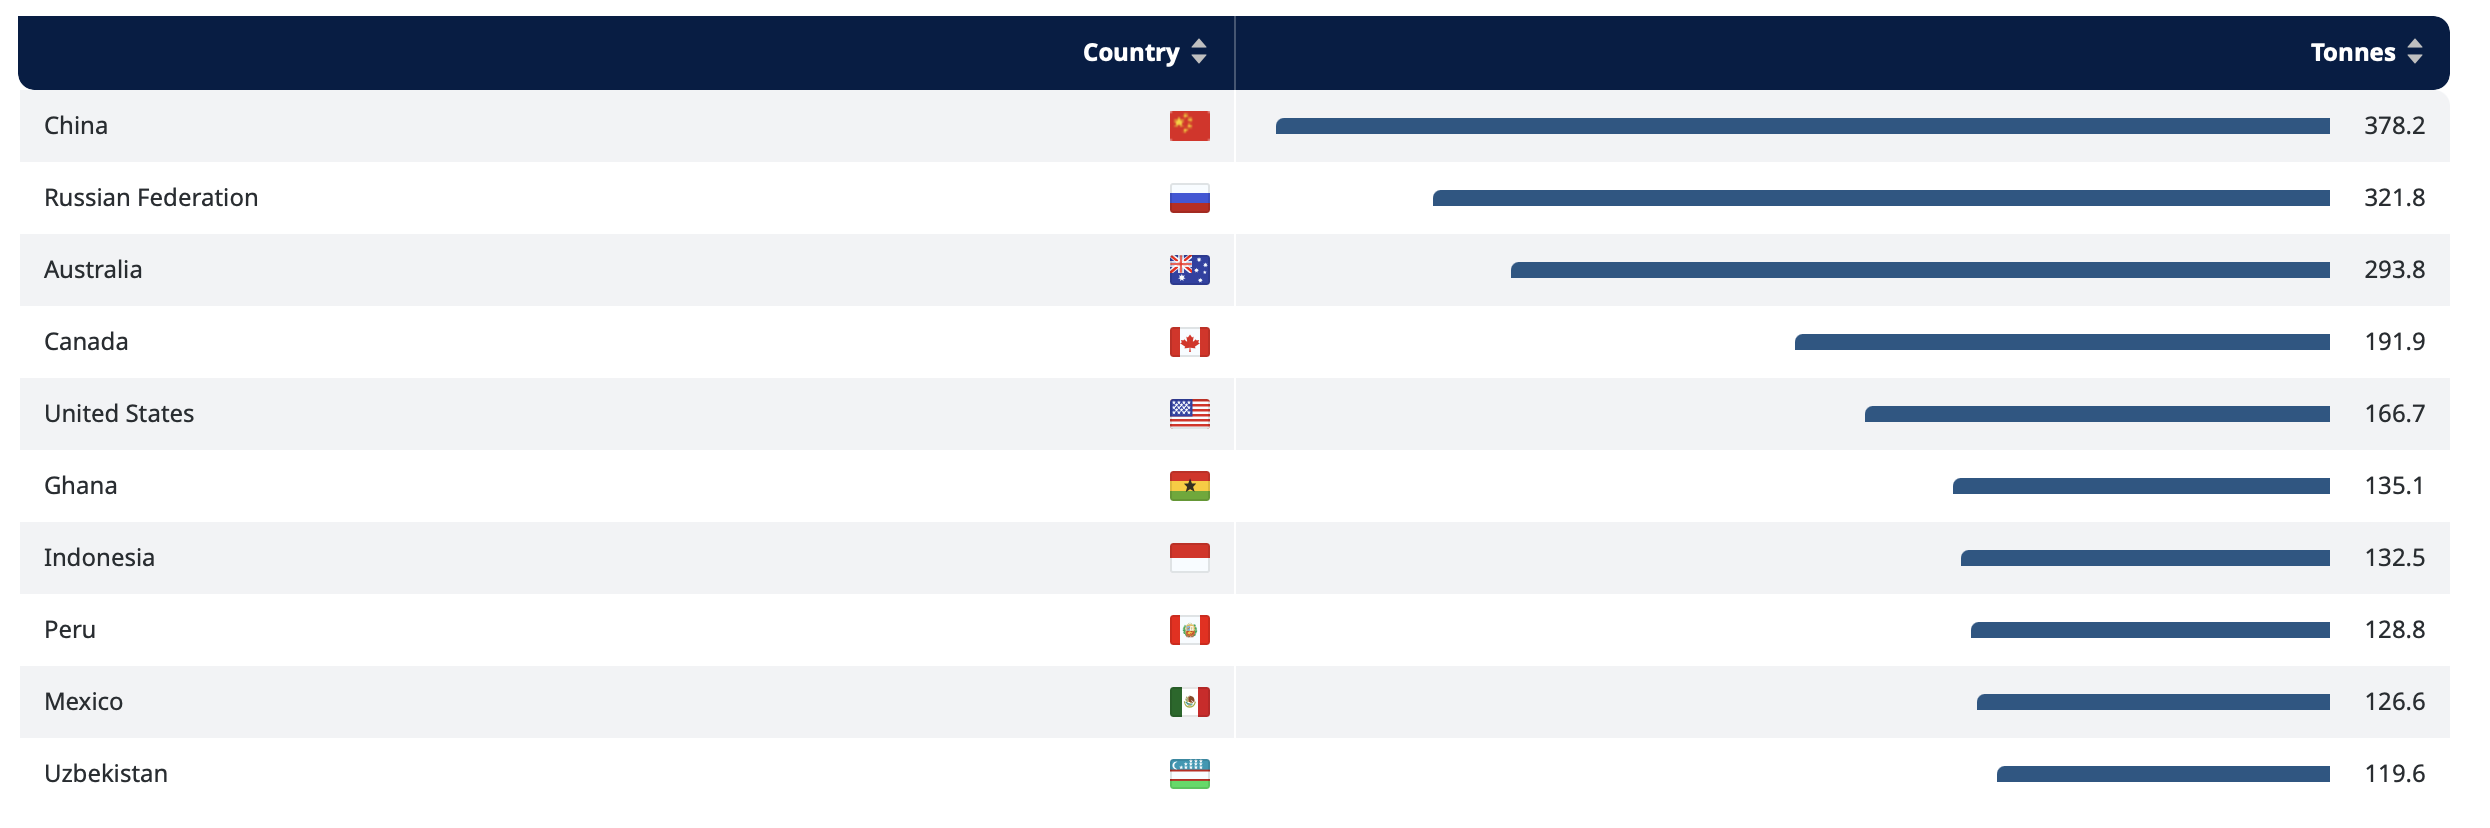
Gold Production by Countries; Data Source WGC as of 31 December 2023
In 2023, global gold production was 3,644 metric tons. China continues to lead as the world’s largest gold producer, contributing about 380 metric tons annually. However, production levels have shown signs of plateauing in recent years due to declining ore grades and increasing extraction costs after the pandemic.
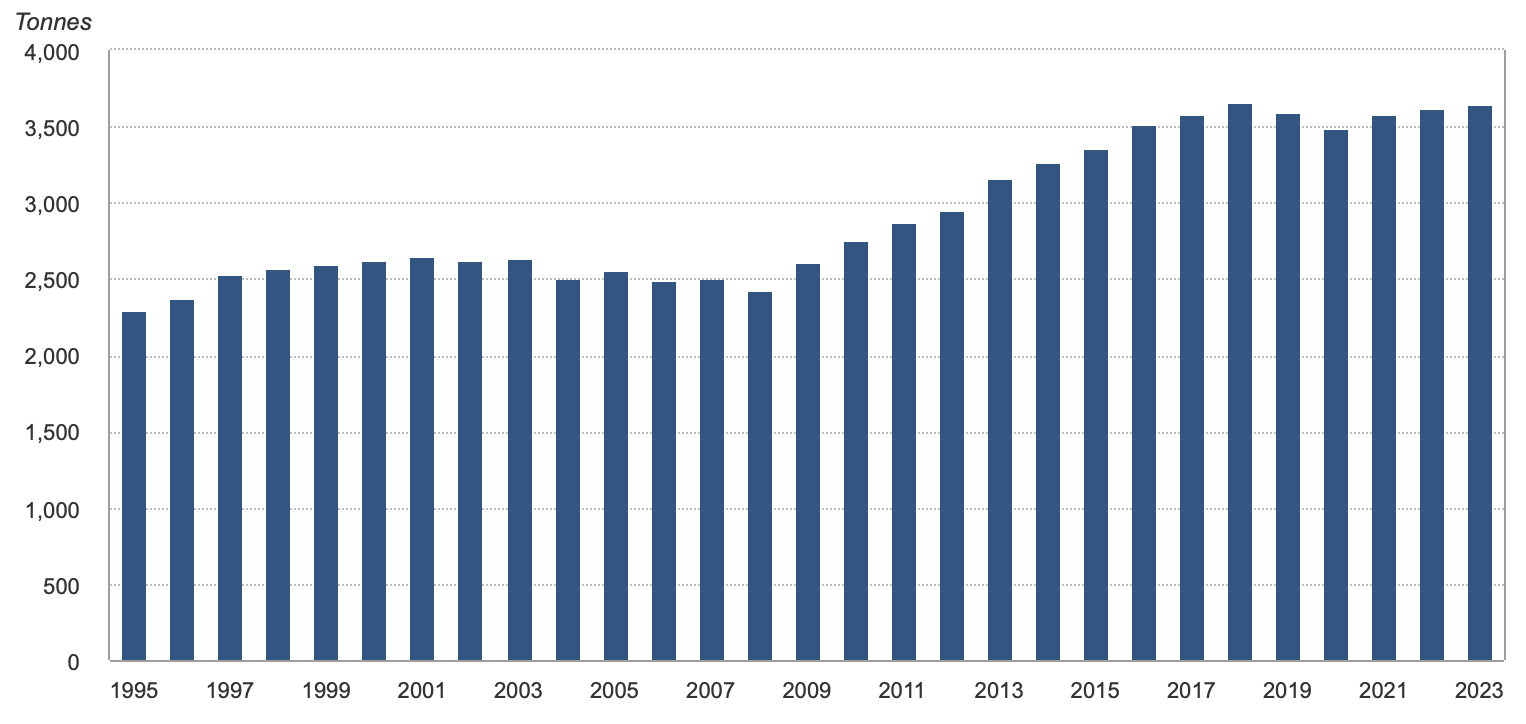
Annual Gold Mine Production; Data Source WGC as of 31 December 2023
Gold Recycling
Beyond mining, gold supply is bolstered by recycled gold, which constitutes about 25% of the total supply. As it is virtually indestructible, nearly all the gold ever mined is theoretically still accessible in one form or another and potentially available for recycling.
Supply | 2022 | 2023 | Y/Y change |
|---|---|---|---|
Mine production | 3,624.8 | 3,644.4 | +1%
|
Net producer hedging | -13.1 | 17.0 | -
|
Recycled gold | 1,140.1 | 1,237.3 | +9%
|
Total supply | 4,751.9 | 4,898.8 | +3%
|
Total Annual Gold Supply; Data WGC as of 31 January 2024
Recycling is the source of gold supply that is most immediately responsive to the gold price and economic shocks as unlike the mining and production process, it can adapt to the gold price environment quickly. Central banks also play a significant role in the gold supply through sales from their reserves, although in recent years, many central banks have shifted from sellers to buyers.
Gold Demand: Who is Buying? How Far the Gold Price Can Go?
Jewellery Consumers: China and Turkey
The jewellery industry remains the largest consumer of gold, accounting for about 50% of total demand. Cultural factors, particularly in countries like India and China, drive this demand. China’s recovery, together with the smaller market – Turkey’s growth in jewellery demand, offsets the decline in India and supports the robust global total in 2023.
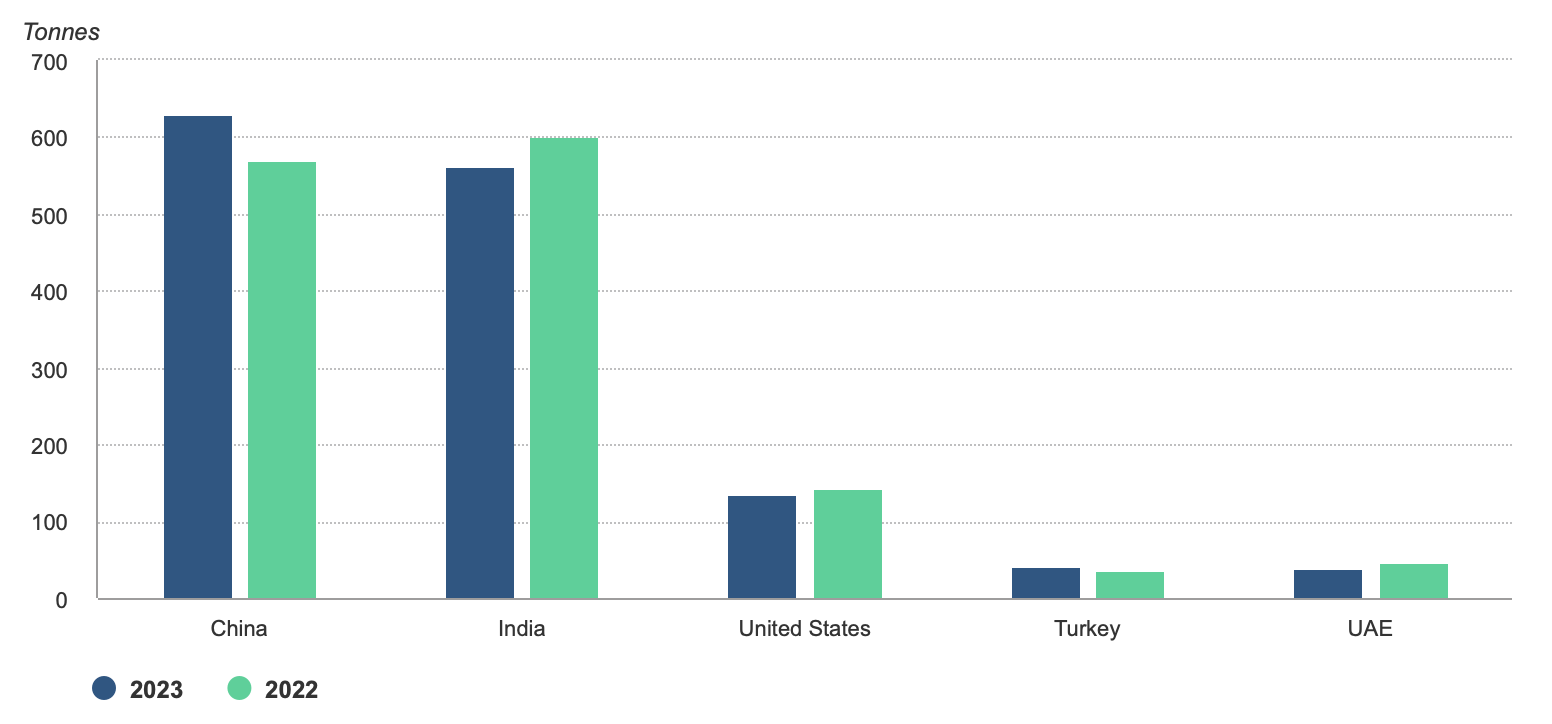
Annual Gold Jewellery Demand (Top Five Countries); Data Source WGC as of 31 December 2023
There is an overall inverse relationship between the price of gold and the demand for gold jewellery. Despite the high gold prices, the demand for gold jewellery has remained relatively stable in recent years, particularly when compared to the pandemic year of 2020, although it is generally lower than the peaks seen in the late 1990s and early 2000s. In 2023, annual jewellery consumption held steady at 2,093 tons, representing 47% of the global demand of 4,448 tons (ex-OTC), even in a very high gold price environment.
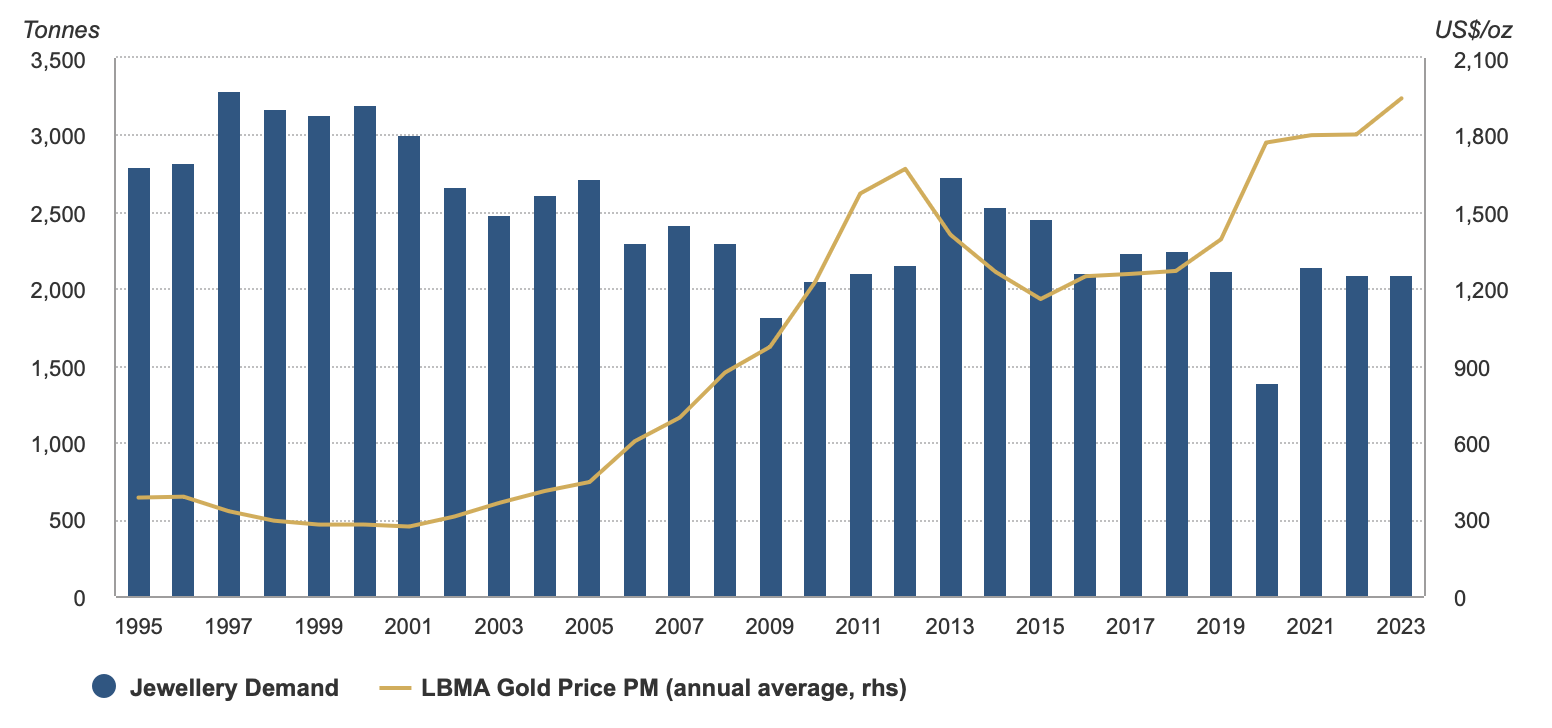
Annual Gold Jewellery Demand; Data Source WGC as of 31 December 2023
This indicates strong consumer purchasing power and a persistently high demand for gold jewellery. However, the question remains: will this demand continue in 2024 with gold prices climbing even higher, over $2,500 per ounce?
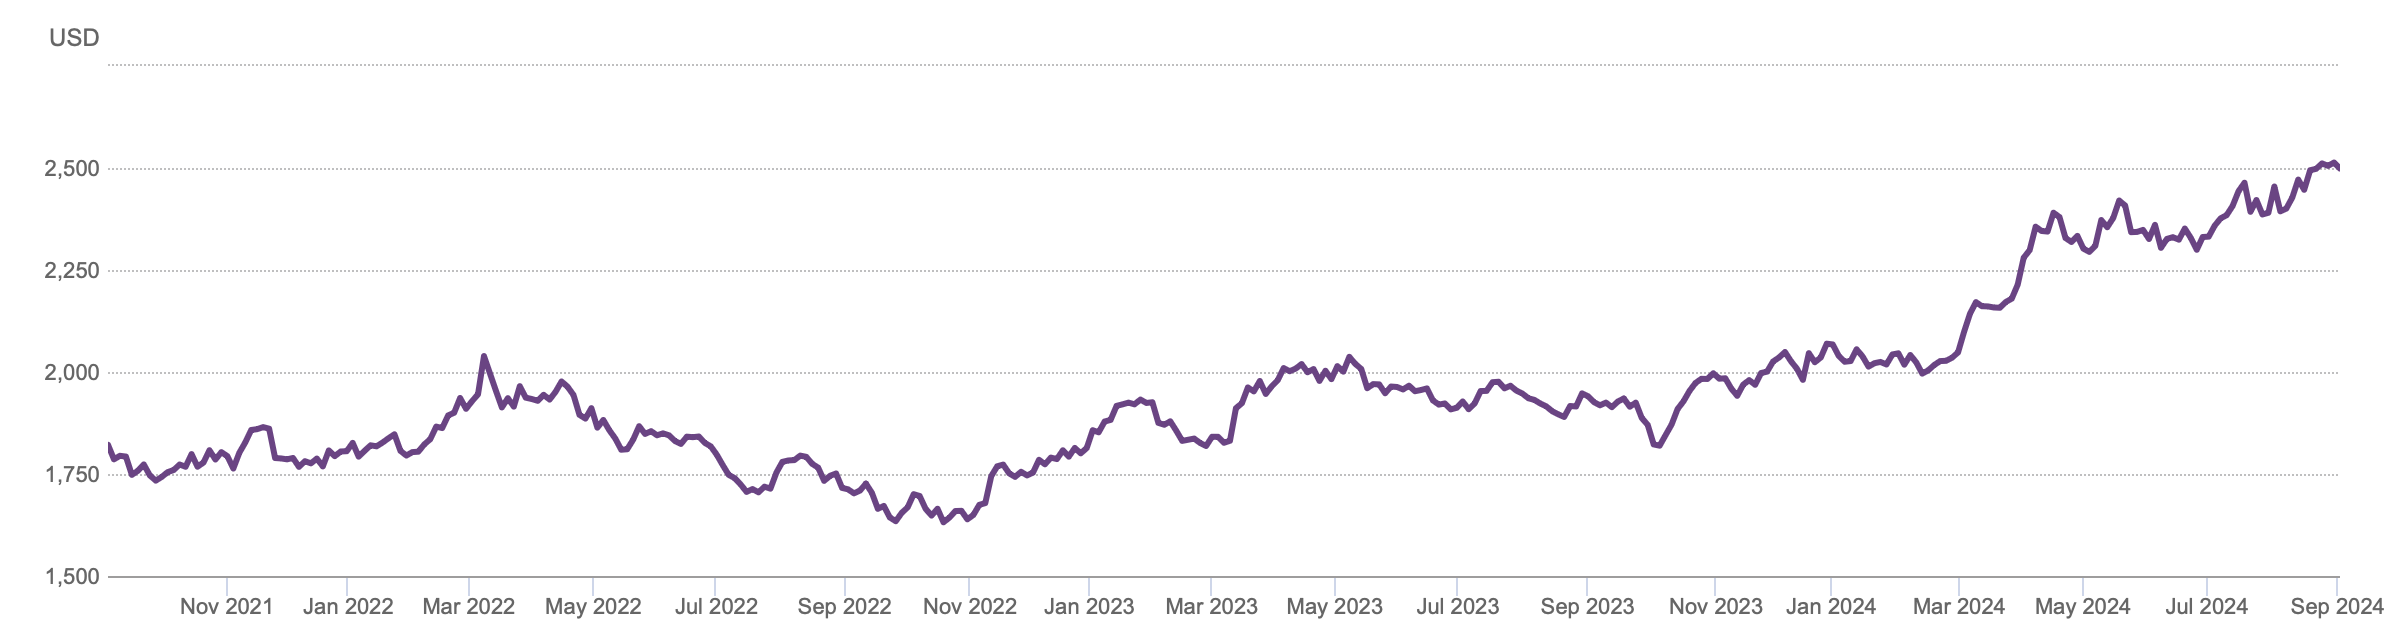
High Gold Price in 2024 (USD/oz); Data Source WGC as of 30 August, 2024
It could negatively impact demand if gold prices remain at such a high level or increase further. At the same time, if global economies continue to recover from the disruptions caused by the COVID-19 pandemic and Russia-Ukraine conflict, increased consumer confidence and spending could support steady or even rising demand for gold jewellery.
Central Banks: China, Poland and Singapore
Central banks are among the most influential buyers of gold, accounting for about 25% of total demand. Central banks globally have been net buyers of gold since 2010, particularly in emerging markets like China, India, and Russia, aiming to diversify reserves and hedge against currency risks.
The annual net gold purchase is 1,037t in 2023, almost matching the 2022 record, falling just 45t short. The net purchases of gold from central banks surged in 2022 after the historical low in 2020, almost double the average annual demand in the past 12 years since 2021, which was mainly caused by the Russia-Ukraine conflict and global inflation surging in 2022.
The demand from central banks was steady in 2023 due to concerns about inflation and potential recession around the globe.
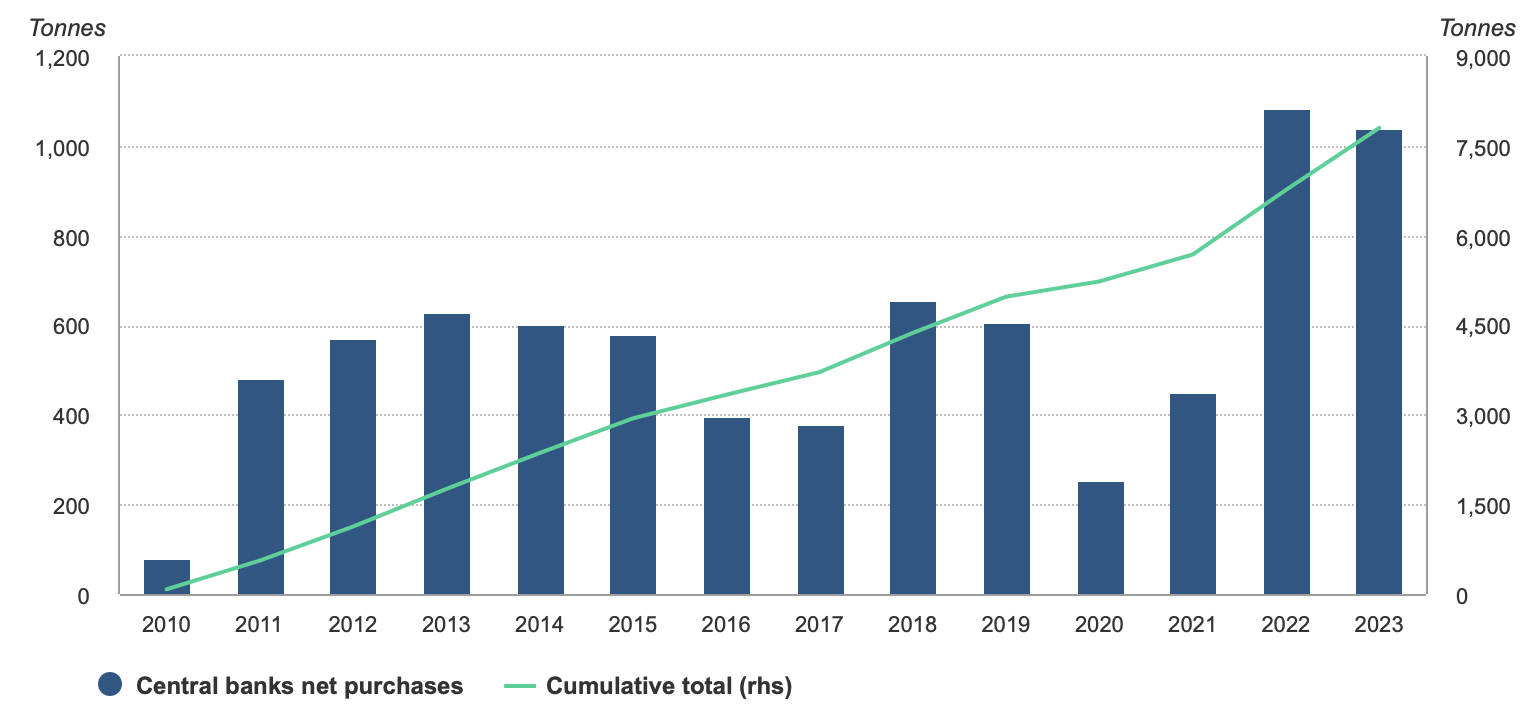
Annual Net Gold Demand From Central Banks; Data Source WGC as of 31 December 2023
The largest buyer in 2023 is China, far surpassing other countries, followed by Poland and Singapore. China’s large purchases are likely motivated by a desire to reduce reliance on the US dollar and diversify its reserves as tensions with the West continue, while countries like Kazakhstan might sell gold to address economic challenges.
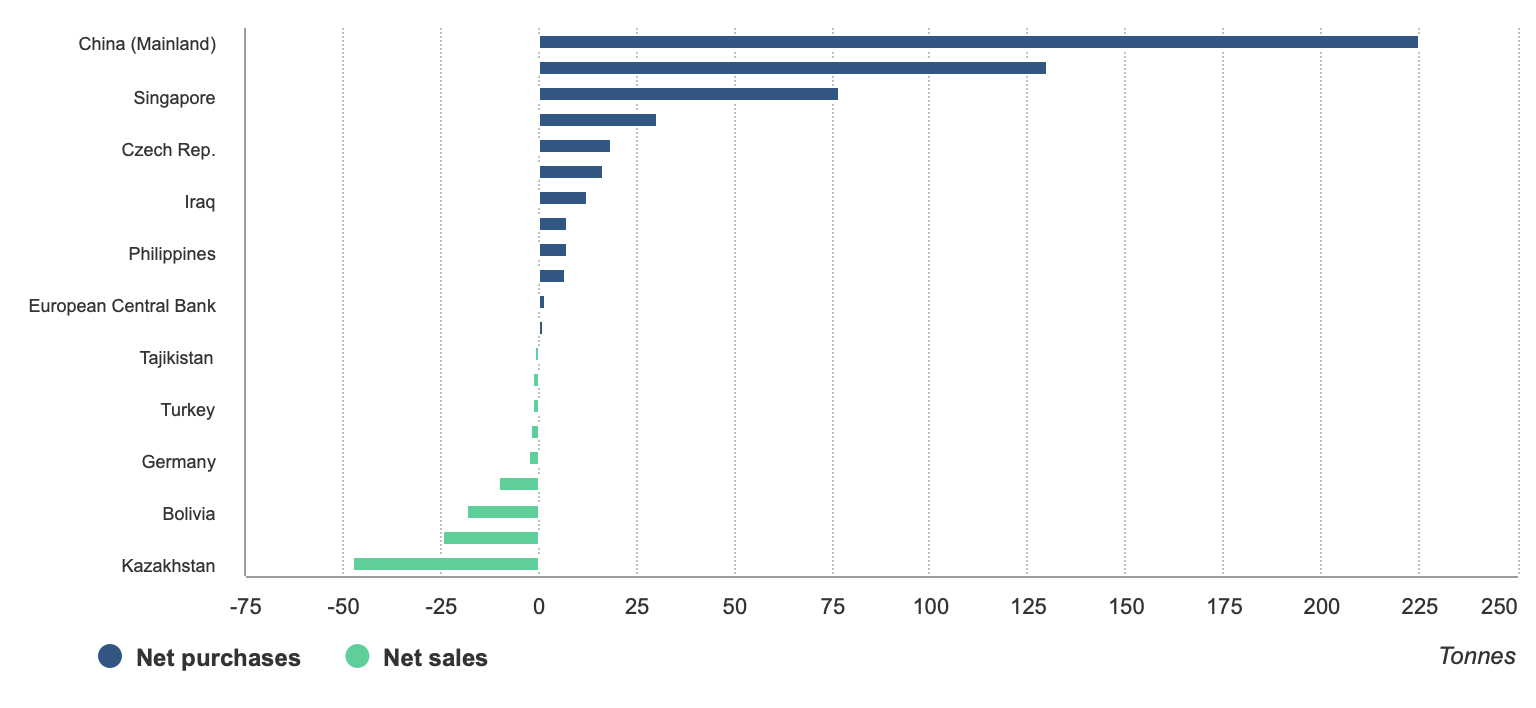
Net Gold Purchase by Country in 2023; Data Source WGC as of 31 December, 2023
Following these record numbers, gold continues to be viewed favourably by central banks as a reserve asset. It raises the question again: will this continue in 2024 and beyond?
The trend of central banks purchasing large amounts of gold could significantly impact gold prices. According to the 2024 Central Bank Gold Reserves (CBGR) survey, which was conducted between 19 February and 30 April 2024 with a total of 70 responses, 29% of the central bank respondents intend to increase their gold reserves in the next twelve months, the highest level that has been observed since 2018, signalling potential high demand from the central bank in 2024. However, to fully understand the trend, many other factors such as geopolitical risks and currency risks must also be considered.
Institutional and Individual Investors: China Being the Main Buyer
Investment demand, including gold ETFs, physical bars and coins, plays a critical role in the gold market, accounting for 25% of the global gold demand, same as the central bank reserve. Investment demand for gold fluctuated a lot in response to global economic conditions in the last 10 years, mainly through ETFs. In uncertain economic times, gold is often seen as a safe-haven asset, as shown in 2020 with the surge in ETF inflows and record gold price, while it has returned to ETF outflows since then.
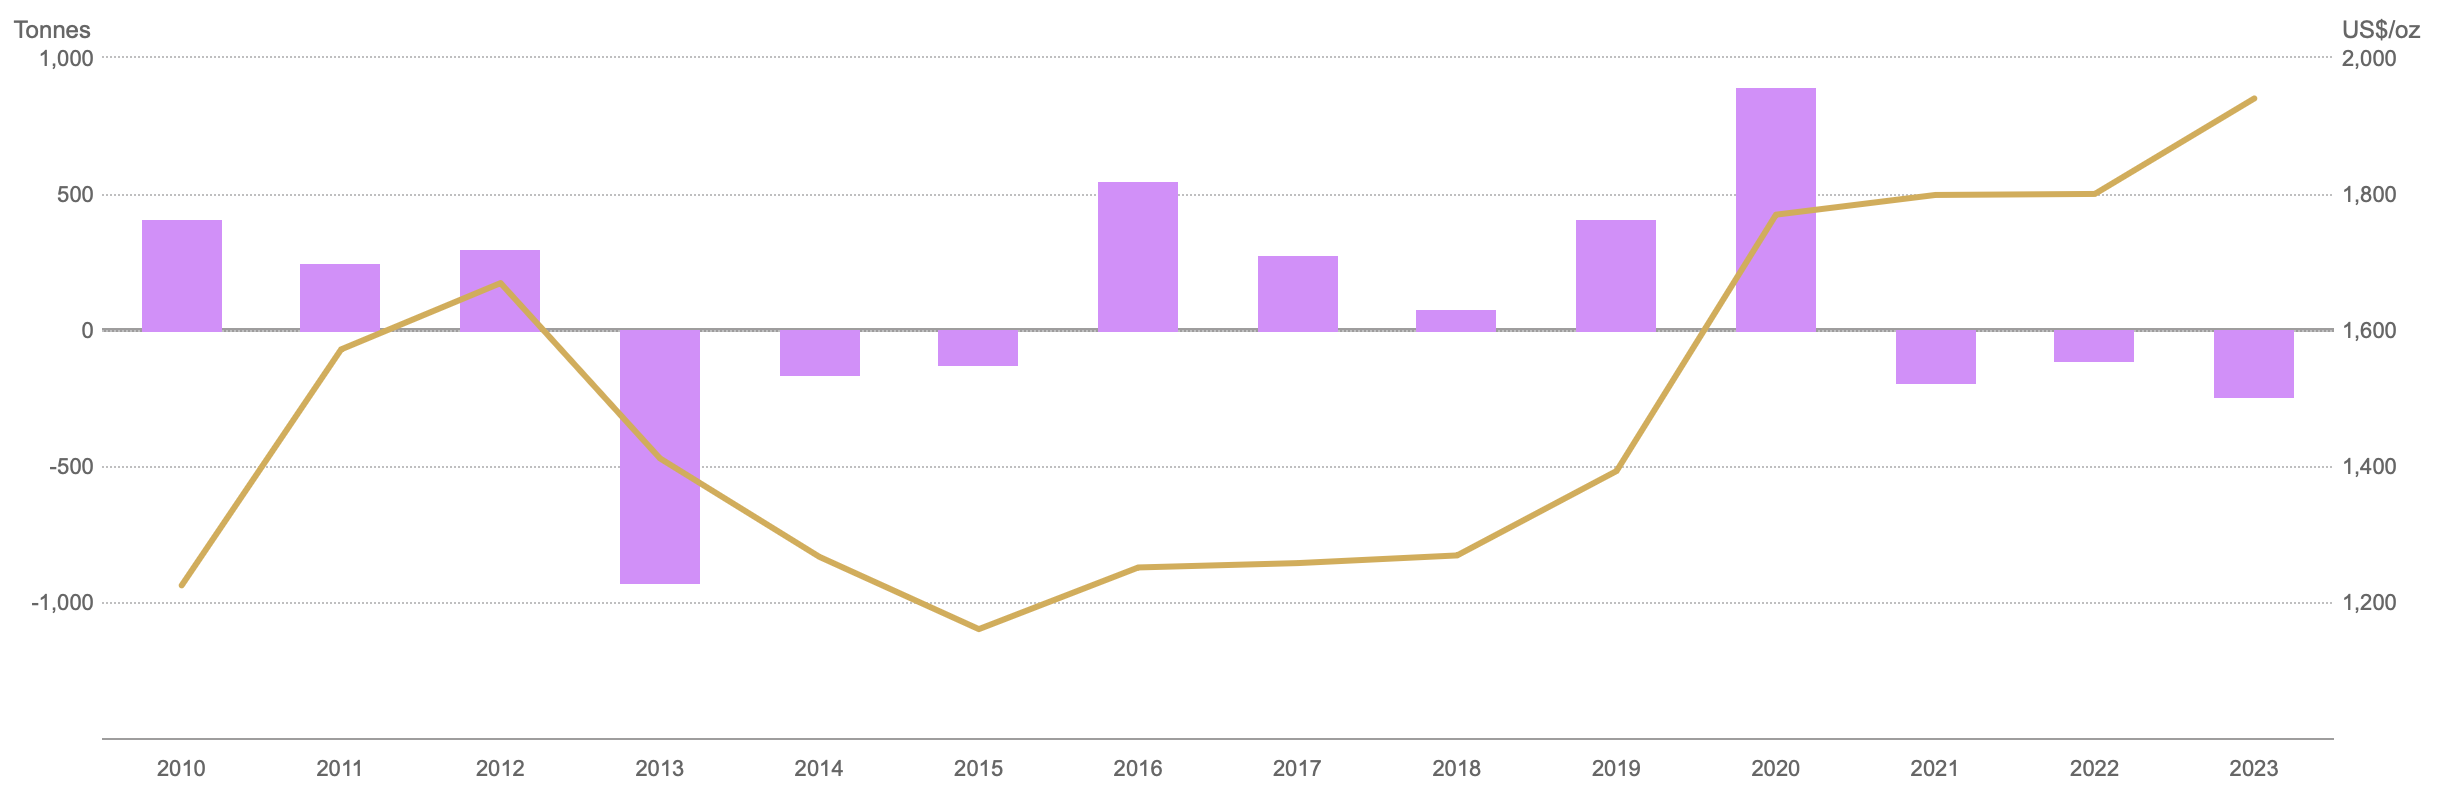
Gold ETFs Flows in Last 10 Years (2018-2023); Data Source WGC as of 30 June 2024
In 2023, total annual gold investment sank to a 10-year low of 945t. This can be related to the profit-taking activities after the sharp rise in gold prices in 2020. Or we are seeing an emerging asset, which serves as an alternative?
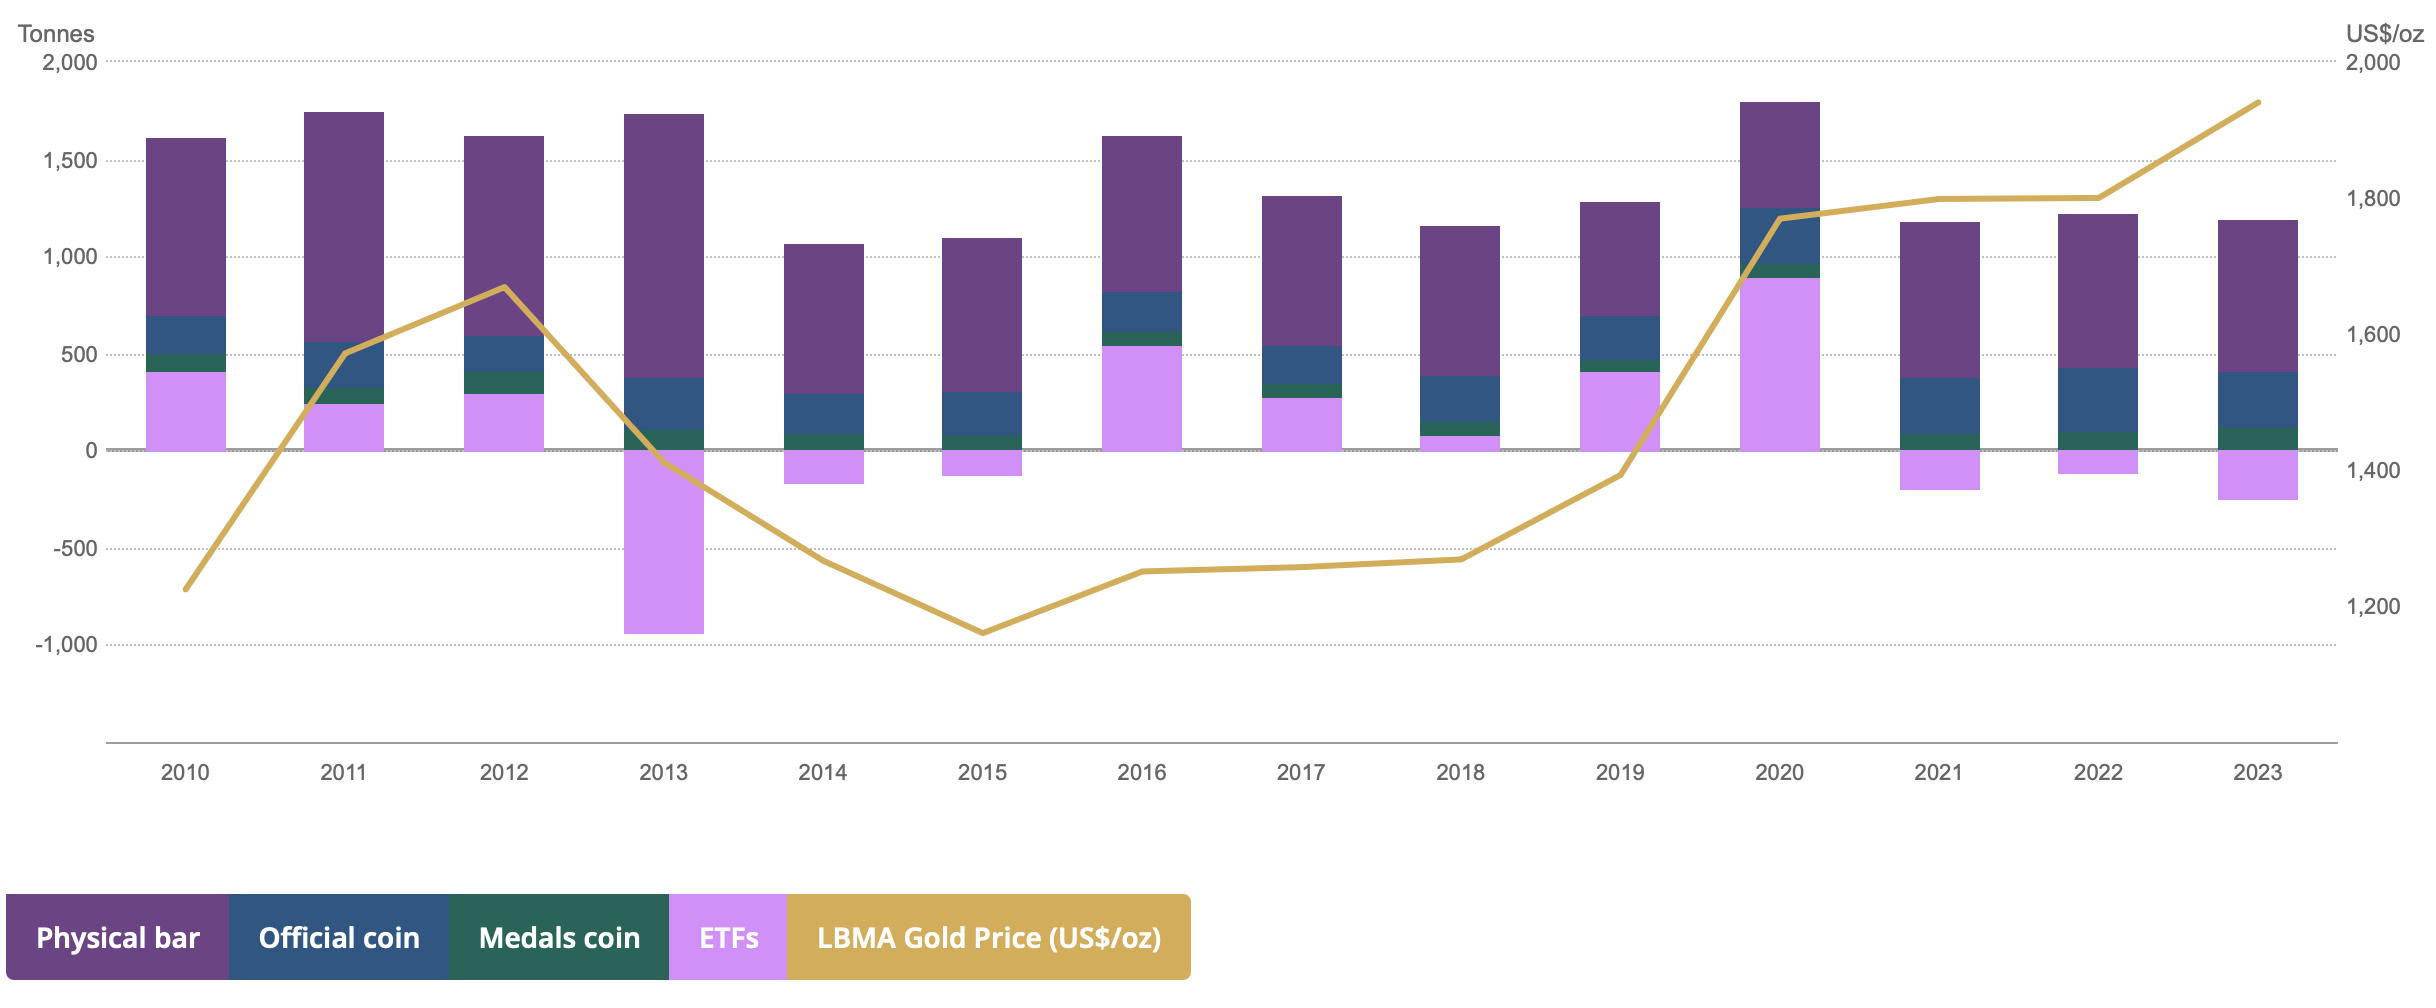
Gold Investment Demand in Last 10 Years (2018-2023); Data Source WGC as of 30 June, 2024
In 2023, Global gold ETFs saw a third consecutive annual outflow, losing 244t, led by Europe.
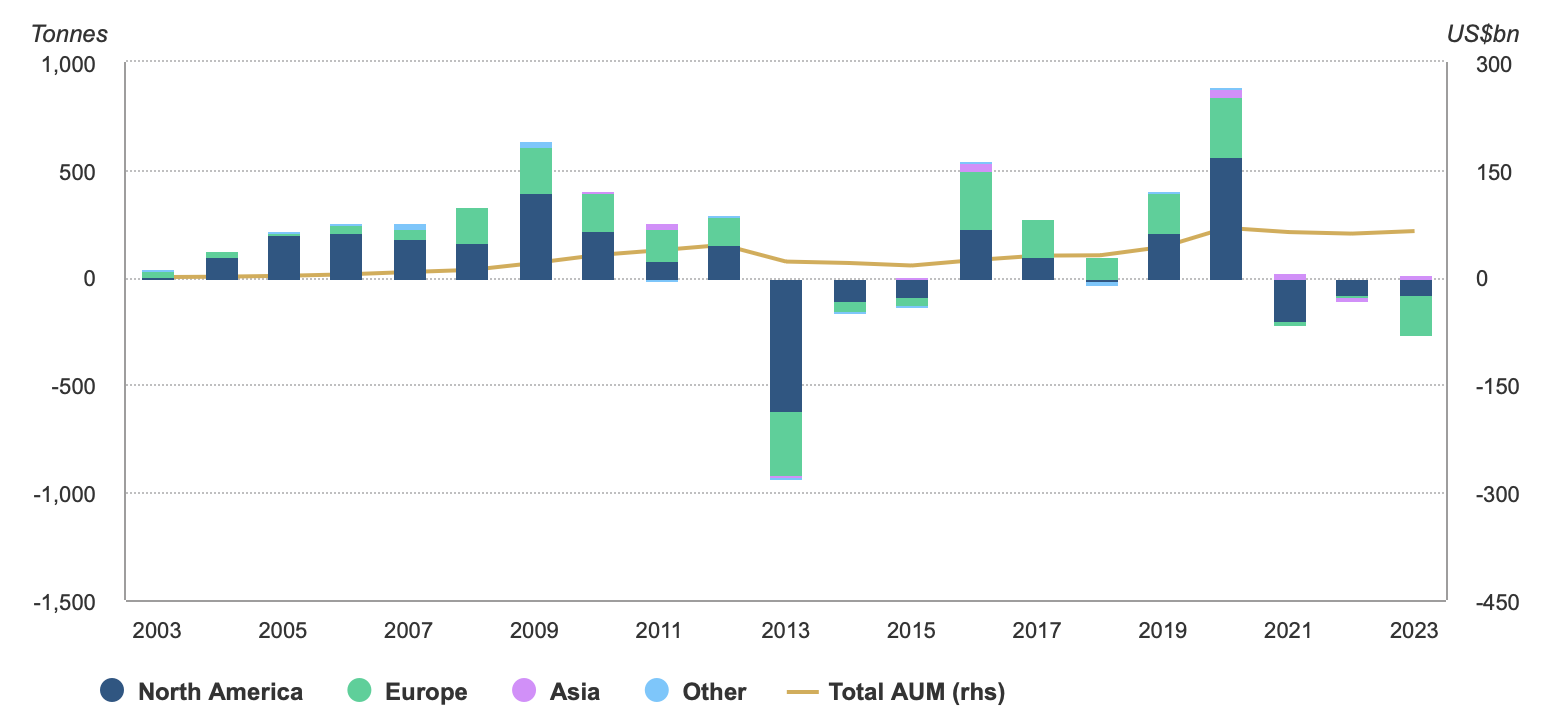
Annual Change in Gold-Backed ETFs By Region; Data Source WGC as of 31 December 2023
However, the steep drop in European gold investment in 2023 was, to a large degree, countered by strength in China (28% y/y). Also, a blistering central bank buying, together with resilient jewellery consumption, offset sizable ETF outflows.
Tonnes | 2022 | 2023 | Y/Y change |
|---|---|---|---|
Investment | 1,113.0 | 945.1 | -15%
|
Bar & coin | 1,222.6 | 1,189.5 | -3%
|
India | 173.6 | 185.2 | +7%
|
China, P.R.: Mainland | 218.2 | 279.5 | +28%
|
Gold-backed ETFs | -109.5 | -244.4 | -
|
Main Factors of Gold Investment Demand; Data WGC as of 31 January 2024
While ETFs fluctuated significantly, demand for physical gold (bars and coins) remained strong and stable, largely driven by cultural factors in regions like Asia and the Middle East, as well as long-term investment strategies, underscoring the importance of ETF flows as key influencers on overall gold investment demand.
Technology
The technology sector consumes around 7% of annual gold demand, primarily for electronics, medical devices, and other industries. The demand variation for technology is mainly contributed by electronics as the other two aspects have been stable all the time. The technology demand is considered nonmaterial and continues to decline given the sluggish electronics market.
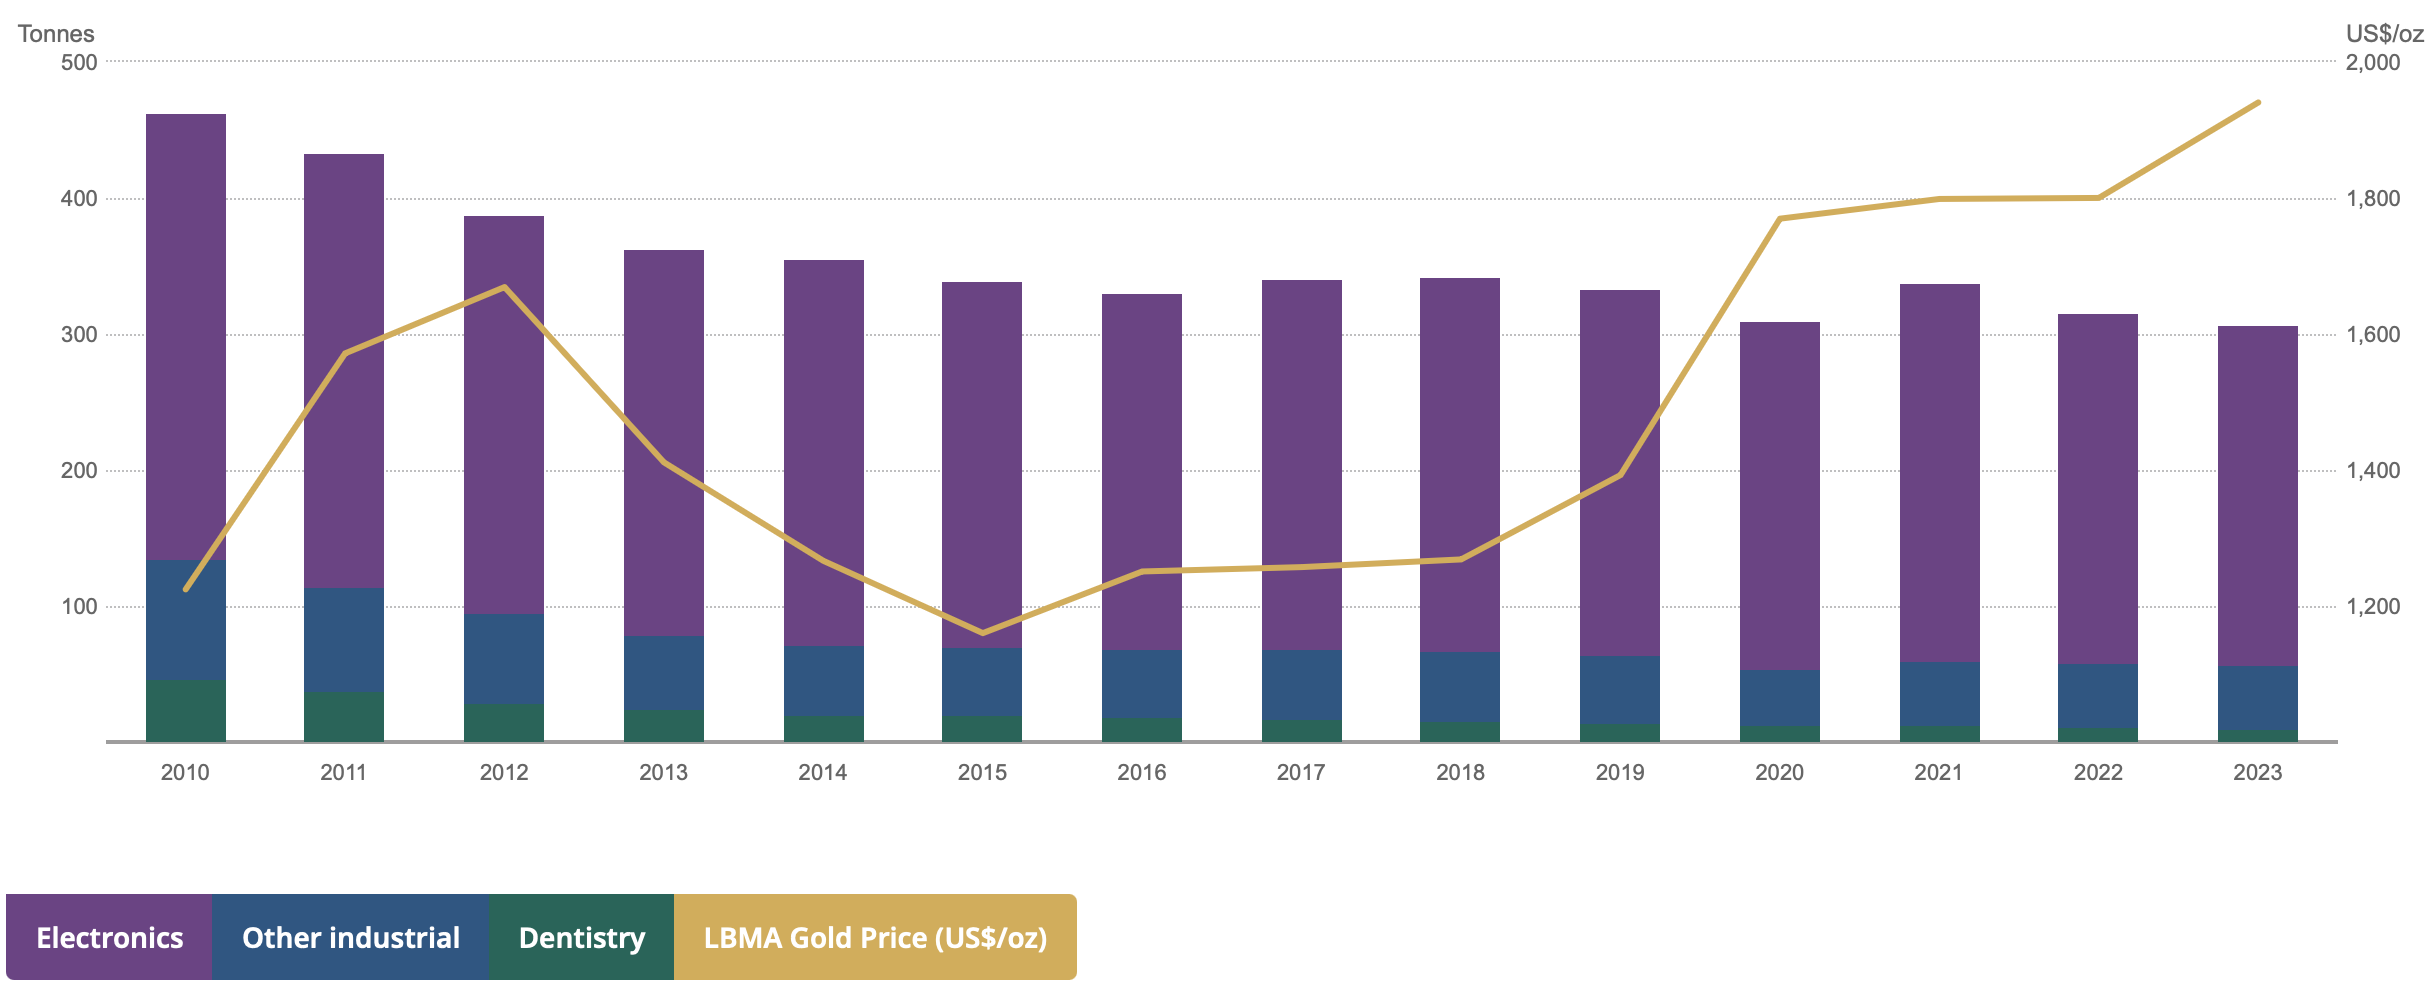
Annual Gold Technology Demand (2010-2023); Data Source WGC as of 31 December 2023
The total gold demand has been stable from 2010 to 2019 at 4,500t, but it has been increasing since the pandemic in 2019, with a 5% (excluding OTC) in 2023 compared to 2022 which is a very strong year. But inclusive of significant OTC and stock flows (450t), total gold demand in 2023 was the highest on record at 4,899t, reflecting strong demand overall in 2023. Additionally, China (including the Chinese government, Chinese investors and Chinese jewellery consumers) is the most active player in the global gold market, with significant contributions in jewellery, investment and central bank reserve demand in 2023, followed by the Polish government, Singapore government and Turkey jewellery consumers.
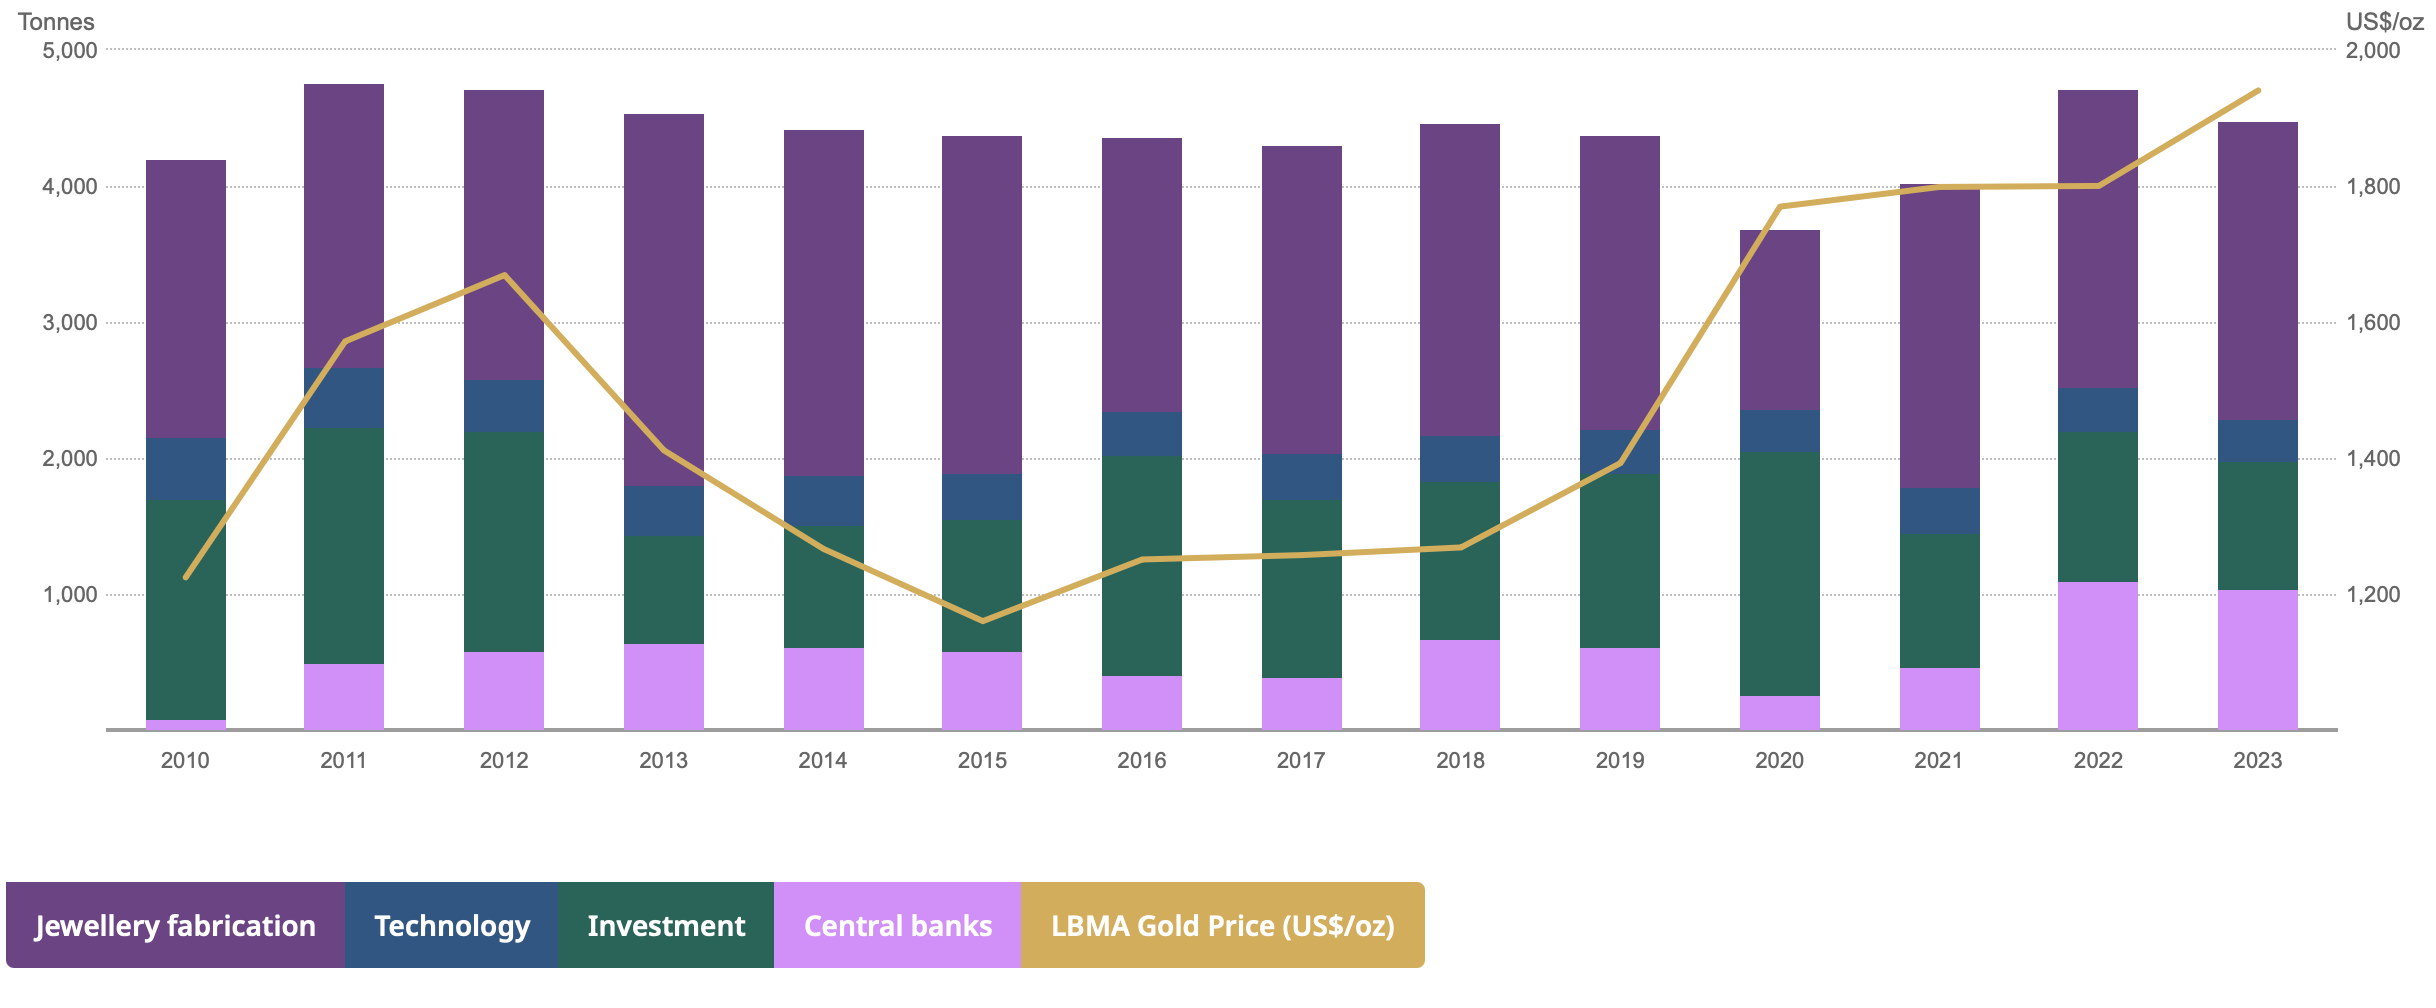
Total Gold Demand by Sector (2010-2023, ex-OTC); Data Source WGC as of 30 June, 2024
Gold remains a vital asset in the global economy, with its demand and supply dynamics influenced by a complex interplay of factors. From individual investors to central banks, the demand for gold is driven by its unique role as a store of value, a hedge against inflation, and a safe-haven asset.
While elevated gold prices may dampen demand in the jewellery sector, this could be offset by ongoing economic recovery, especially in countries like China. Central banks’ plans to increase gold reserves are likely to provide strong support for prices. ETF flows, which have shown signs of outflows for years, could reverse if economic uncertainties persist.
J.P. Morgan Research projected in July 2024 that gold prices could reach $2,500/oz by year-end. However, with prices already surpassing this estimate and climbing to $2,518/oz as of 30 Aug 2024, investors are murmuring a price as high as $2,640 by year-end.
Beyond conventional gold investments, we wonder, in an era where sustainability and environmental impact are increasingly prioritized, whether ‘green gold’ investments exist for money managers engaged in sustainable investments. Or, is crypto the substitute?