


How Much Does Leading ESG Score Tell Us About the Company?
Hong Kong, Jul 12, 2024
Case Study: Silvercorp Metals ESG Ratings: MSCI vs. Sustainalytics
In our last meeting with Silvercorp Metals Inc. (SVM) regarding their Environmental, Social, and Governance (ESG) practices, we received their internal ESG reports from two major ESG rating institutions – MSCI and Sustainalytics. We conducted an analysis of these reports to identify the differences between the two ESG rating methodologies and their alignment with mainstream ESG frameworks.
The primary objective of our research was to compare the ESG reports from MSCI and Sustainalytics and to evaluate how these reports overlap with mainstream ESG frameworks. Additionally, we analysed SVM’s share performance relative to mining ETFs – the VanEck Junior Gold Miners ETF (GDXJ) and VanEck Gold Miners ETF (GDX) (as they include miners mainly doing gold and silver which is comparable to SVM), to understand SVM’s performance within the precious metals sector for the past 12 months given its good ESG rating score. We also examined the correlation between SVM’s ESG performance and its stock volatility to assess the impact of ESG practices on the company’s stock performance.
Comparison of ESG Reports from MSCI and Sustainalytics
Both of the ESG rating reports use two types of ESG scores to determine their final ESG rating:
Exposure Score: Represents all risks the company faces, including both managed and unmanaged risks
Management Score: Reflects the risks the company managed out of the total manageable risks.
The final ESG rating is derived from the gap between the ESG risks faced by the company and the risks managed by the company, that is, how much risk the company manages out of all the ESG risks it faces.
MSCI and Sustainalytics’ reports cover a comprehensive range of ESG indicators relevant to the mining industry, with significant overlap with the SASB (Sustainability Accounting Standards Board) framework. While both reports extensively cover all indicators especially for environmental metrics, the SASB framework includes more detailed aspects, particularly in governance, such as Management of the Legal & Regulatory Environment and Systemic Risk Management.
Both ESG reports contain less than one-third quantitative indicators, presenting a challenge for automating ESG ratings, as many key indicators remain qualitative and require human evaluation.
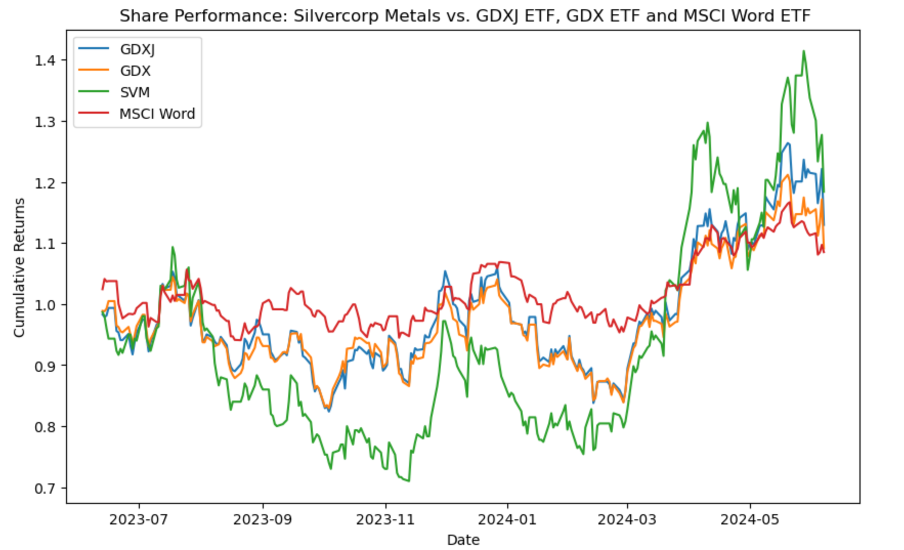
SVM’s Share Performance Comparing to Existing Mining ETFs
The ESG reports from MSCI (top 42% in the precious metals mining industry) and Sustainalytics (top 32% in the precious metals mining industry) indicate that SVM has an above-average ESG rating. And it indeed has performed better in terms of sharp ratio for the trailing 12 months.
Chart 1 and Chart 2 show that SVM’s stock generated the highest return of 18.39% compared to the GDX and GDX Junior ETFs over past 12 months. Despite its higher volatility, SVM’s returns compensated for this, resulting in a superior Sharpe ratio of 0.31.
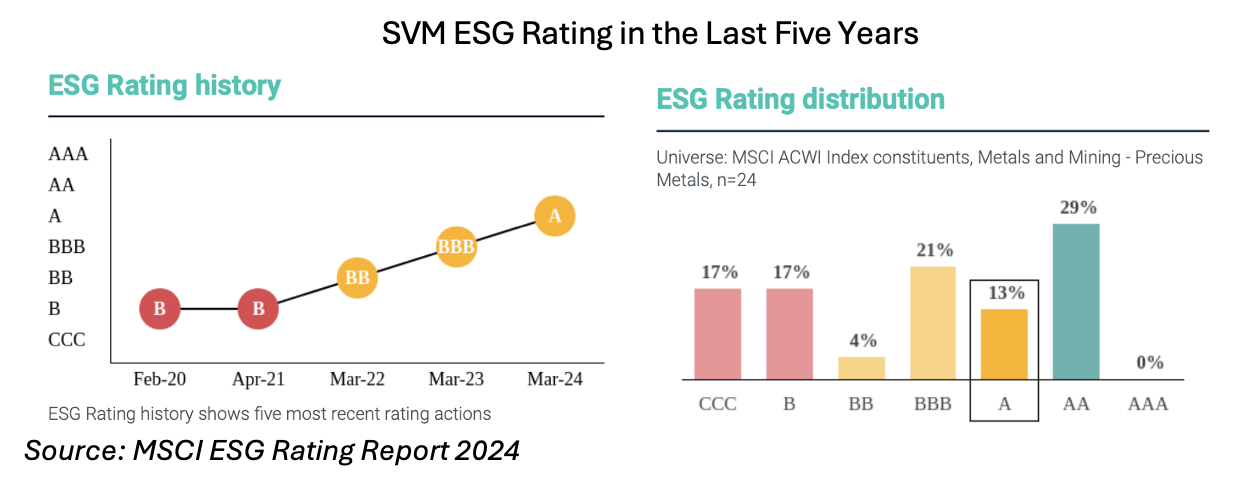
Does a higher ESG score lead to better stock performance?
From Chart 3, we can see that SVM’s MSCI ESG rating has shown consistent improvement over the past five years, rising from ‘B’ to ‘A’. The company’s ranking in the precious metals mining industry improved from the top 84% in 2020 to the top 42% in 2024 (the rating was quantified as the quantiles by mapping the ESG rating to the ESG Rating distribution).
Chart 4 shows the Annualized Volatility and the MSCI ESG Rating Quantile of SVM in the last five years, the correlation between them is 0.42, showing a moderate relationship between the ESG performance of the company and its volatility.
To conclude, our comprehensive comparison of MSCI and Sustainalytics ESG reports highlights the challenge to automate ESG reporting given the current low quantitative portion (less than 1/3) and the high overlap of their ESG indicators with leading ESG framework SASB. A scoring methodology specifically designed for the mining industry is necessary to effectively evaluate extra-financial metrics that are most relevant and material to the sector. This tailored approach would involve a less arbitrary assessment process and cause less confusion, as the existing scoring metrics often have low correlation to the company’s stock performance.
Annualized volatility | Annualized return | Sharpe ratio | |
|---|---|---|---|
SVM | 47.49% | 18.39% | 0.31 |
GDXJ | 34.53% | 12.96% | 0.27 |
GDX | 31.26% | 9.13% | 0.18 |
MSCI World | 19.63% | 8.50% | 0.25 |
SVM ESG rating and volatility
2020 | 2021 | 2022 | 2023 | 2024 YtD | |
|---|---|---|---|---|---|
Annualized volatility | 70.95% | 56.04% | 43.80% | 38.86% | 53.95% |
MSCI ESG rating quantile | 84% | 84% | 67% | 63% | 42% |